WildMetrix Correlation Analyzer
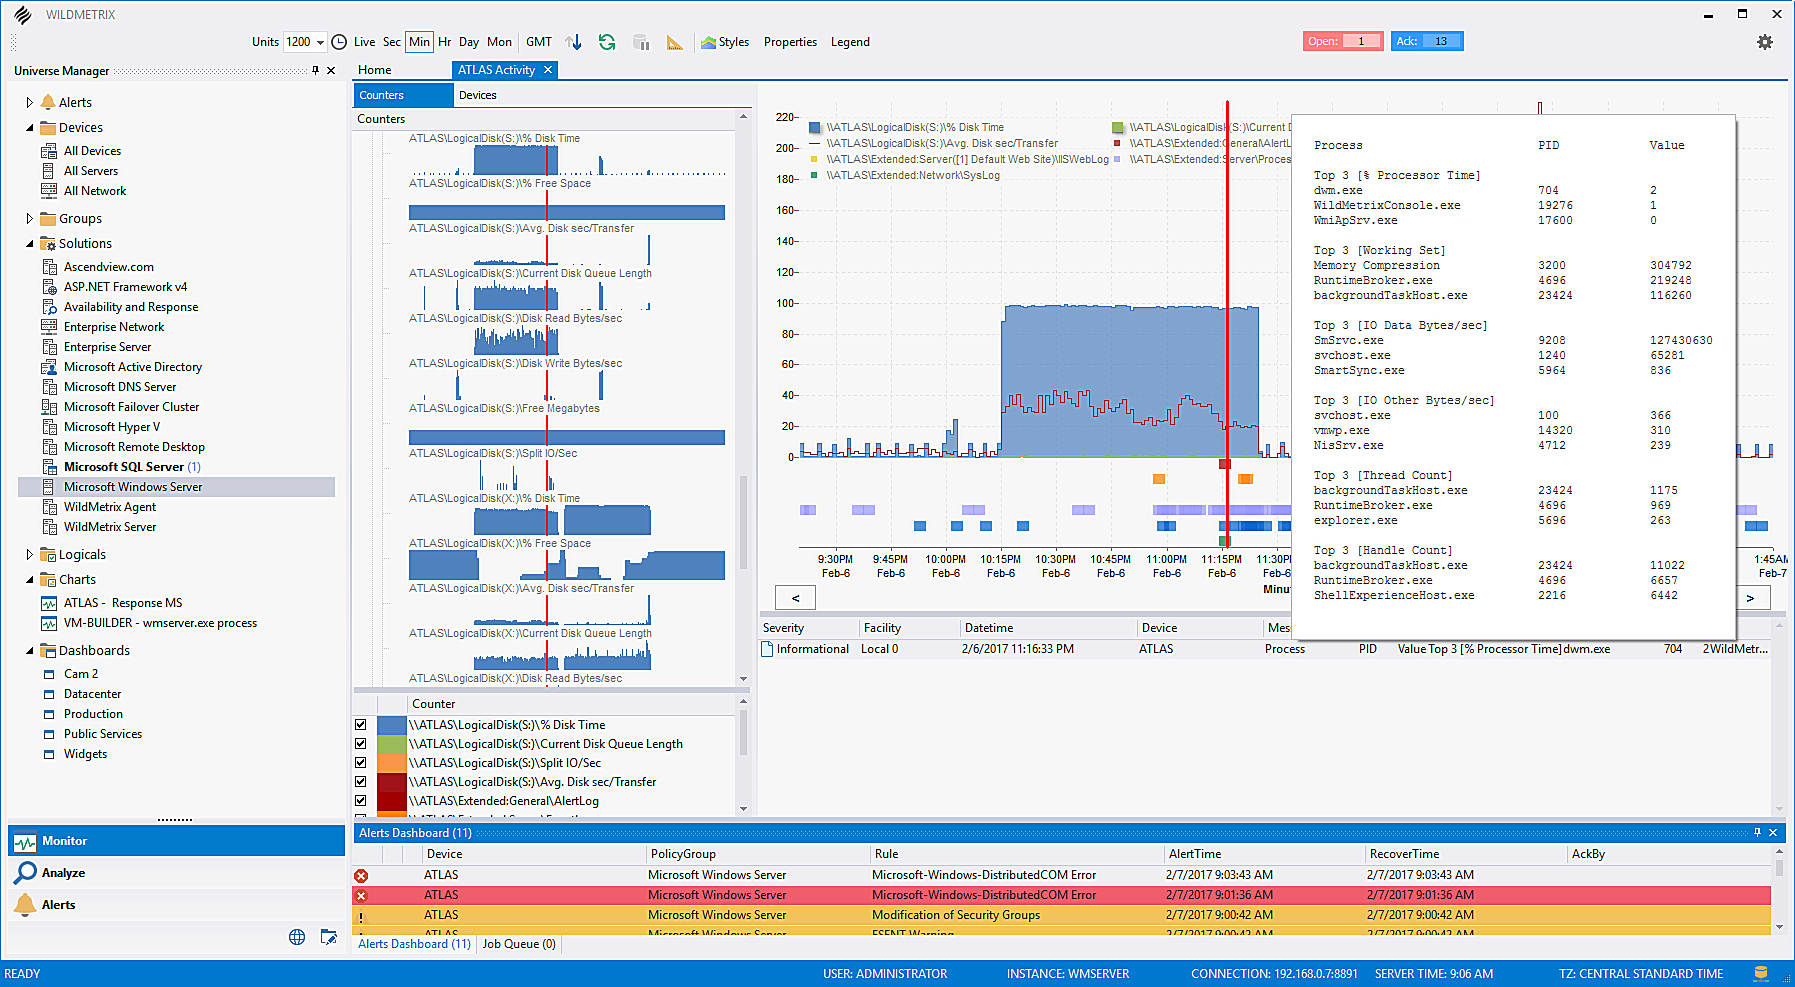
WildMetrix Performance Correlation Analyzer simplifies the daunting task of finding and correlating relative performance, event, and specific data across the dependent stack in a single view.
The Mission critical applications of today’s business can be spread across multiple networks, datacenters, and virtual infrastructures. WildMetrix is real time and keeps up with the tick by tick changes of production performance and events. The ability to cross correlate processes and events with underlying and dependent resources is necessary when isolating problems distributed across this landscape.
- Reduce Triage Time - Pinpoint the root cause of critical problems significantly faster by simplifying the task of finding and correlating relative performance, event, and specific data across the dependent stack.
- Increase Service Reliability - Pinpoint the areas of under-performing and faulty applications across the entire datacenter and keep track of past issues to ensure they stay remediated.
 (click for larger view)
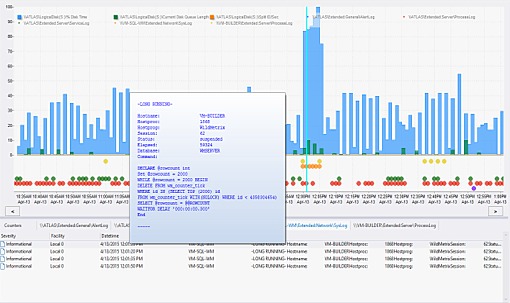
Real-time Problem Solving - (2 minute example)
Imagine a reoccurring high disk IOPS seemingly causing issues in a virtual datacenter. With WildMetrix Correlation Analyzer you are able to quickly cross correlate a Virtual SQL Server running a sql statement
performing a large data operation. This operation is creating wait states in the virtualized sql server creating
a slow down not only on disk for other applications, but for additional applications reliant on the SQL server. So what application is causing this? With process tracking
in WildMetrix we can easily cross correlate and identify the virtual server responsible for the transient process that ran during this time and executed the sql statement.
(Total time to identification is less than 2 minutes.)
- Correlate performance metrics, fault and log data from an data source such as web services, databases, custom scripts for aggregating and logging any requirement.
- Correlate any process starts and stops with spikes or drops of any performance metric on any device.
- Correlate any event log entry with any performance metric on any device such as connections or application pool workers.
- Correlate long running pages, high web connections and web requests with sql counters such as batch requests and wait states.
- Correlate security events from security logs and security appliances with process start, stops, connections, and faults.