Monitoring with Event Tracing for Windows (ETW)
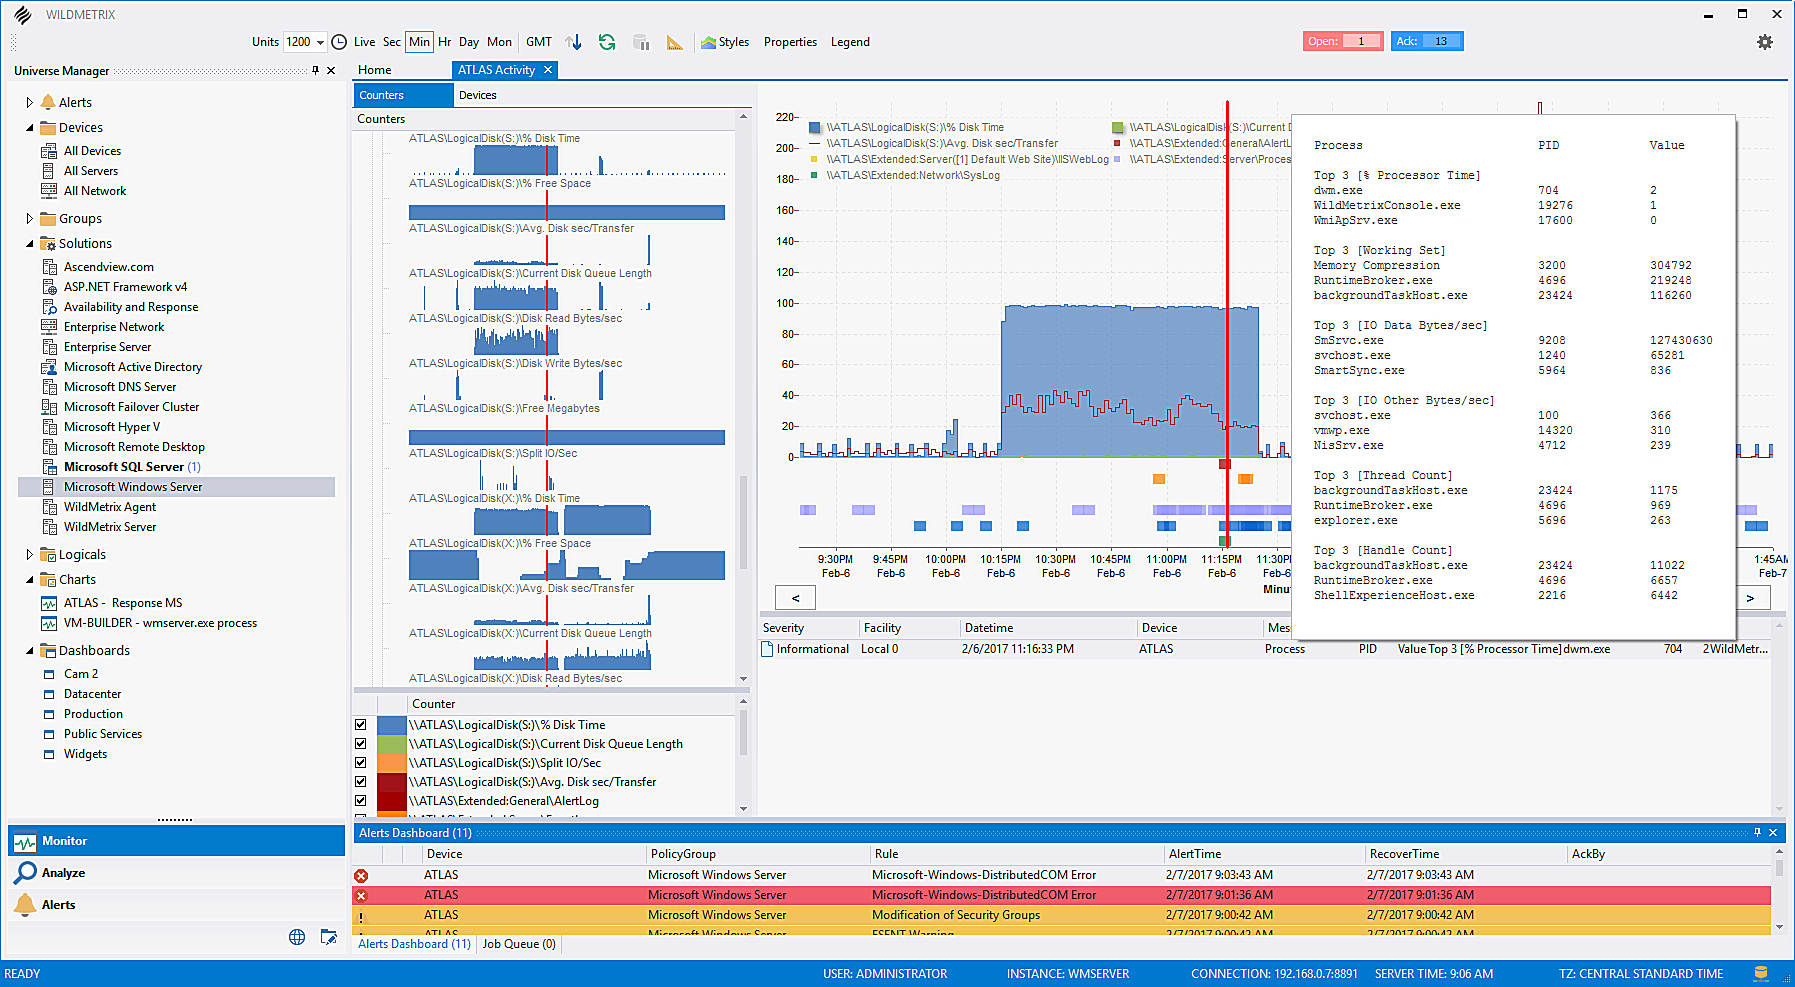
Monitor any Trace Event Source Provider for insight into Kernel and User mode information.
- Supports multiple providers and keywords in a single session.
- Supports aggregation and filtering for custom performance counters.
- Monitor and alert on specific data and aggregate values.
- Correlate provider data with performance counters, web pages, and events.
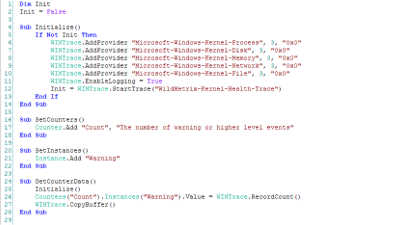
ETW Extensibility Scripting
Monitor multiple event providers in a single live section. Data can be logged, filtered, and aggregated into performance counters. Optionally generate alerts and take remedial action or trace snapshots with xperf for further analysis in Windows Performance Analyzer.